
MAT Stock: Bearish Outlook
This significant plunge in price has done some considerable damage to the Mattel stock chart. This price plunge could be the beginning of a more sinister plot in which MAT stock continues to get crushed at the expense of investors.
The rationale behind these bearish beliefs is centered around the style of investment analysis that I employ. Technical analysis is the basis of my investment views and trading strategies. This style of investment analysis uses historical price and volume data to discern trends and forecast future prices.
Advertisement

The damage caused by this substantial plunge in MAT stock is now suggesting that a primary bearish trend that began in 2014 is now set to resume.
The following Mattel stock chart illustrates the technical damage that this plunge in price has created.
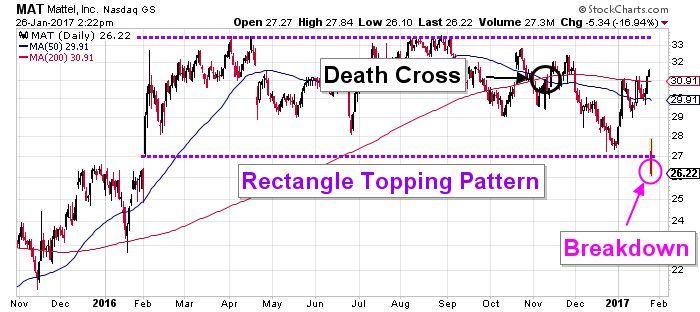
Chart courtesy of StockCharts.com
The MAT stock chart above illustrates that the plunge in price has completed a technical pattern that suggests that a top has been formed. If this is correct, this topping pattern was in development for approximately one year, and a bear market has just been initiated. The rectangle price pattern that is illustrated above is characterized by a horizontal level of resistance and a horizontal level of support. This pattern can be either a topping pattern or a continuation pattern. What sets these two apart is the direction that price exits it.
The death cross was generated when the faster 50-day moving average crossed below the slower 200-day moving average. This is a bearish indicator that traders use to confirm a trend. The generation of this indicator, while the price was confined inside the rectangle pattern, should give a clue about the direction in which the price is going to exit the rectangle pattern.
The following Mattel stock chart illustrates further developments that support much lower prices.
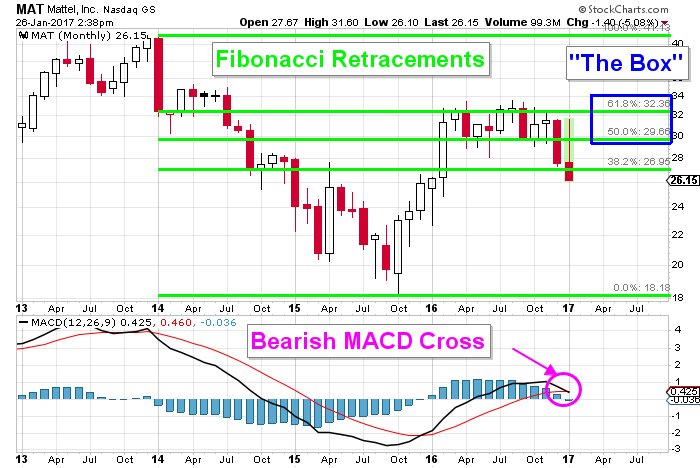
Chart courtesy of StockCharts.com
The MAT stock chart above supports the notion that lower prices are set to prevail. The Fibonacci retracement numbers are a tool used by traders to identify counter-trend price objectives. The theory behind these numbers is that, once a primary move is complete, the price will retrace approximately 50%–62% of the move before the primary trend reasserts itself. Over the years, traders have begun to refer to this retracement as trading into “the box.”
The current rally off the lows that were created in October 2015 stalled after the price entered the box. This was an indication that the rally off those lows was only a counter-trend rally, and that the primary trend is to the downside. The current plunge in MAT stock reinforces this view, and the indicator in the lower panel doesn’t refute this claim.
The moving average convergence/divergence (MACD) indicator is crossing in a bearish manner. MACD is a simple and effective indicator that traders use to identify the bias of momentum. The bearish cross is confirming that bearish momentum is now beginning to overwhelm bullish momentum. Under these conditions, lower Mattel stock prices can be expected, because the path of least resistance is lower.
All of these indicators serve to suggest that the primary trend is to the downside, and it is now set to resume. This primary bearish trend suggests that Mattel stock will be testing the lows that were generated in October 2015, around $18.00, in the not-too-distant future.
Bottom Line on MAT Stock
The plunge in price that Mattel stock experienced after a dismal earnings report has set the tone in which MAT stock is now set to resume its primary bear market trend toward lower prices.